Home Price Index Highlights: December 2019
BY MOLLY BOESEL HOUSING AFFORDABILITY, REAL ESTATE
- National home prices increased 4% year over year in December.
- Full year (average) 2019 appreciation was 3.6%.
- Home prices are forecast to rise 5.2% from December 2019 to December 2020 and to average 4.6% for the full year 2020.
National home prices increased 4% year over year in December 2019 and are forecast to increase 5.2% from December 2019 to December 2020, according to the latest CoreLogic Home Price Index (HPI®) Report.
The December 2019 HPI gain was down from the December 2018 gain of 4.4% and was up from the November 2019 gain of 3.5%.
Price appreciation averaged 3.6% for full year 2019, a large slowdown from the 2018 full year average of 5.8%.
Home price growth started last year off at 4.2% in January, dipped down to 3.3% in late summer, but then started climbing back in November, reaching 4% at the end of the year.
The full year average for 2020 is expected to climb to 4.6%.

The HPI has increased on a year-over-year basis every month for more than seven years (since February 2012) and has gained 63% since hitting bottom in March 2011.
As of December 2019, the overall HPI was 9.8% higher than its pre-crisis peak in April 2006.
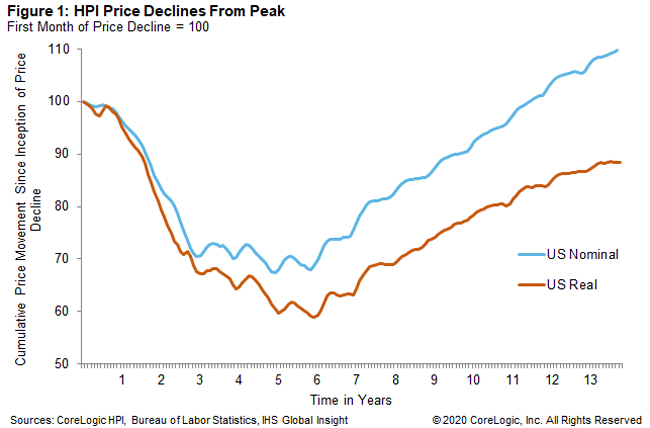
Adjusted for inflation, U.S. home prices increased 2.2% year over year in December 2019 and were 11.5% below their peak[1].
Figure 1 shows the cumulative price movement since the inception of price declines for both the nominal HPI and the inflation-adjusted HPI, as well as the time in years since the first decrease in the indices.

CoreLogic analyzes four individual home-price tiers that are calculated relative to the median national home sale price[2].
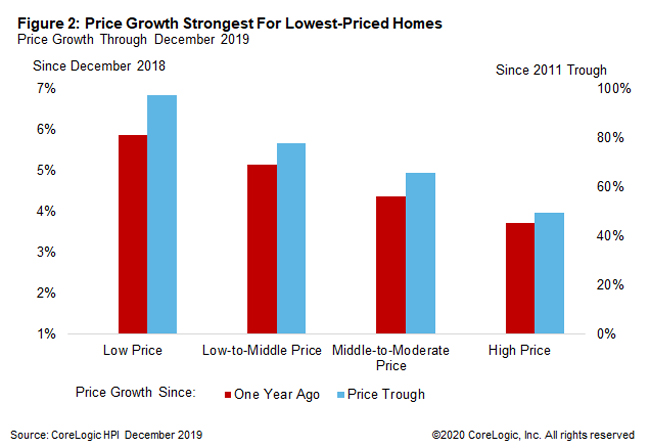
The lowest price tier increased 5.9% year over year in December 2019, compared with 5.2% for the low- to middle-price tier, 4.4% for the middle- to moderate-price tier, and 3.7% for the high-price tier.
Cumulative price gains since the 2011 trough were strongest for lower-priced homes, with the lowest price tier gaining 97.5%, the low- to middle-price tier gaining 77.8%, the middle- to moderate-price tier gaining 65.8% and the high-price tier gaining 49.3%.
Figure 2 shows the change from a year ago and from the 2011 trough for each HPI price tier.

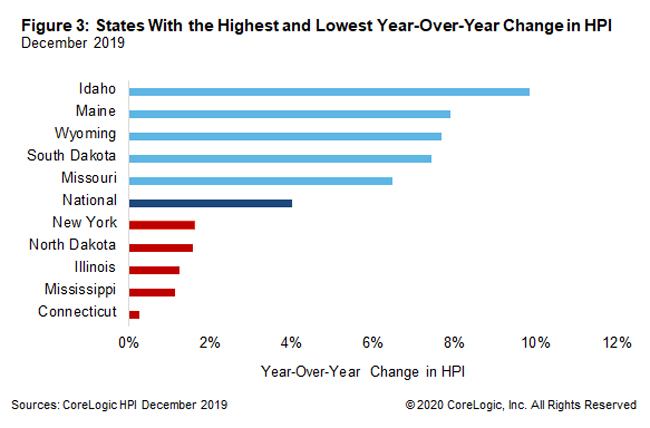
Figure 3 shows the year-over-year HPI growth in December 2019 for the 5 highest- and lowest-appreciating states.
Idaho led the states in appreciation as it has since late 2018, with annual appreciation of 9.9% this December, far above any of the other leading states. At the low end, Connecticut home prices increased by just 0.2% from December 2018. Prices in 41 states (including the District of Columbia) have risen above their nominal pre-crisis peaks.
Connecticut home prices in December 2019 were the farthest below their all-time HPI high, still 17.2% below the July 2006 peak. While annual price increases slowed in 33 states compared with a year earlier, the cooling was most pronounced in Nevada. Prices in Nevada increased by 3.1% year over year in December 2019, a 7.4 percentage point slowdown from the 10.5% annual increase in December 2018.
© 2020 CoreLogic, Inc. All rights reserved
[1] The Consumer Price Index (CPI) Less Shelter was used to create the inflation-adjusted HPI.
[2] The four price tiers are based on the median sale price and are as follows: homes priced at 75% or less of the median (low price), homes priced between 75% and 100% of the median (low-to-middle price), homes priced between 100% and 125% of the median (middle-to-moderate price) and homes priced greater than 125% of the median (high price).
Source: Core Logic
